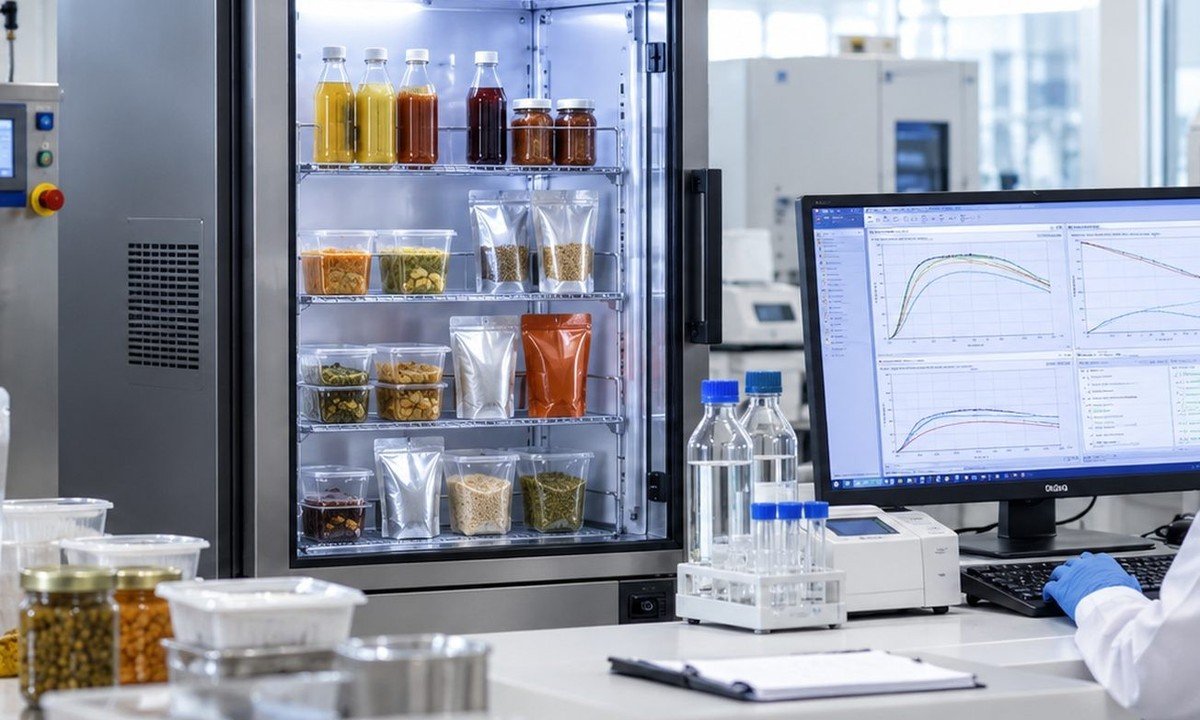
FTIR analysis in cosmetics: identifying polymers, waxes and emulsifiers
A 2024 study used FTIR spectroscopy to confirm plastic microparticles in cosmetics on sale in Sri Lanka. What it found, what it did not prove, and how labs use ATR-FTIR to identify the non-volatile ingredients that GC-MS cannot see.
By Dr. Premalatha, Ph.D., Life Science, Regulatory Consultant, Cosmetic Science Lab · Reviewed by Shreya Rangarajan
The study behind this article
- Paper
- Gamage and Mahagamage, Heliyon 2024 [1]
- Products
- 15 brands across 5 categories (face wash, facial scrub, baby products, shaving cream, skin cream); triplicates from different production batches
- Design
- Market survey: brands chosen by questionnaire, particles extracted with Fenton reagent, screened with Nile Red, confirmed by FTIR
- Key finding
- 7 of 15 brands flagged by Nile Red; FTIR confirmed microplastics in 6
- Polymers
- Mainly low-density polyethylene and ethylene–propylene copolymer
- Funding
- The authors state the work received no specific funding
Quick answer
- What is FTIR analysis? Fourier transform infrared spectroscopy identifies a material from the infrared radiation its chemical bonds absorb. The resulting absorption spectrum works like a fingerprint [3].
- It fills the gap left by GC-MS: polymers, waxes, emulsifiers and thickeners are too large or non-volatile to pass through a gas chromatograph.
- In a 2024 study, FTIR confirmed plastic microparticles in 6 of 15 cosmetic brands; a dye screen alone flagged 7 [1].
- FTIR tells you the type of material, not usually its exact grade or level, so labs pair it with other techniques.
Take-home message for formulators
- Send the dried, non-volatile residue to FTIR and the volatile fraction to GC-MS
- Keep reference spectra for every wax and polymer lot to catch supplier switches
Take-home message for brand owners
- A dye screen is not proof: only a spectrum confirms a microplastic
- Use FTIR as a fast first check before a "microplastic-free" claim
01What the study found
The authors used a consumer questionnaire to pick the three most-used brands in each of five categories, and tested triplicates from different production batches [1]. They digested each product with Fenton reagent to remove organic matter, stained the residue with Nile Red, and examined particles that glowed. Seven brands were positive for Nile Red. FTIR then confirmed true plastic in six; the seventh contained ethyl cellulose beads [1].
The confirmed polymers were mainly low-density polyethylene and an ethylene–propylene copolymer. Most particles were irregular and white, with mean sizes from about 239 to 451 µm across products. One facial scrub yielded about 3.4 g of microplastic per product [1].
The gap between seven and six is the useful lesson. A stain flags candidates; only the infrared spectrum showed that one brand's beads were ethyl cellulose, not plastic [1].
02What the study did not prove
- Small, single-market sample. Fifteen brands in one country cannot describe the global market.
- Top brands only. Three of the most-used brands per category were tested, so smaller brands are not covered.
- No exposure data. The study measured presence, not skin uptake or harm.
- Library-dependent. Identification relies on matching spectra to reference libraries, and weathered or additive-rich particles match less cleanly [5].
- Quantities for two products only. Microplastic mass was measured in one facial scrub (about 3.4 g per product) and one face wash (about 0.2 g) [1].
03How FTIR works, briefly
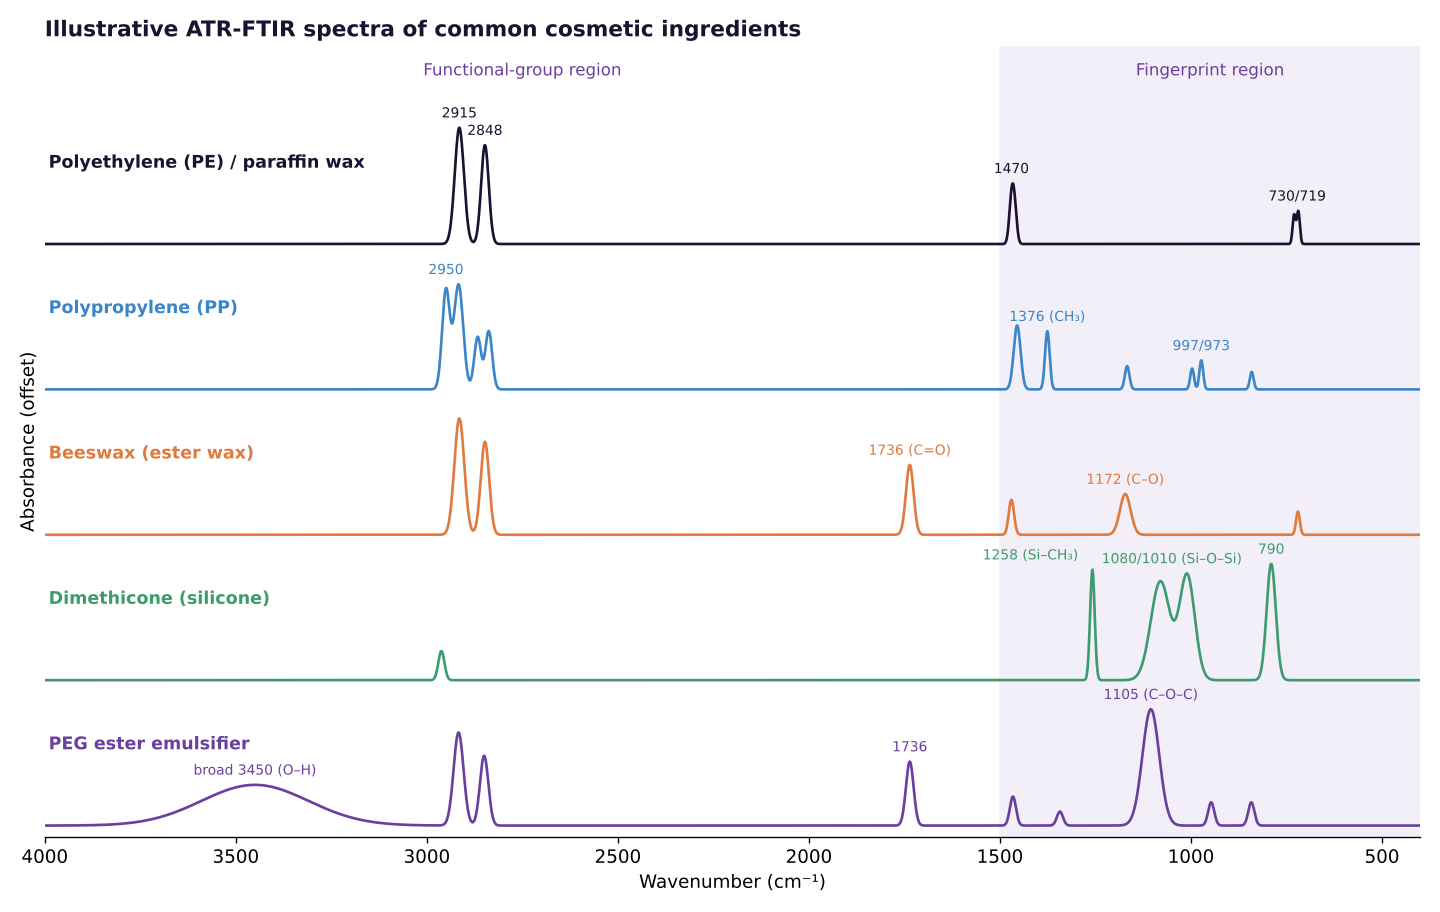
Every functional group absorbs infrared light at characteristic wavenumbers: C–H stretches near 2900 cm⁻¹, ester C=O near 1736 cm⁻¹, Si–O–Si near 1000–1100 cm⁻¹ [3]. A Fourier transform turns the raw interferometer signal into a spectrum of absorbance against wavenumber [4].
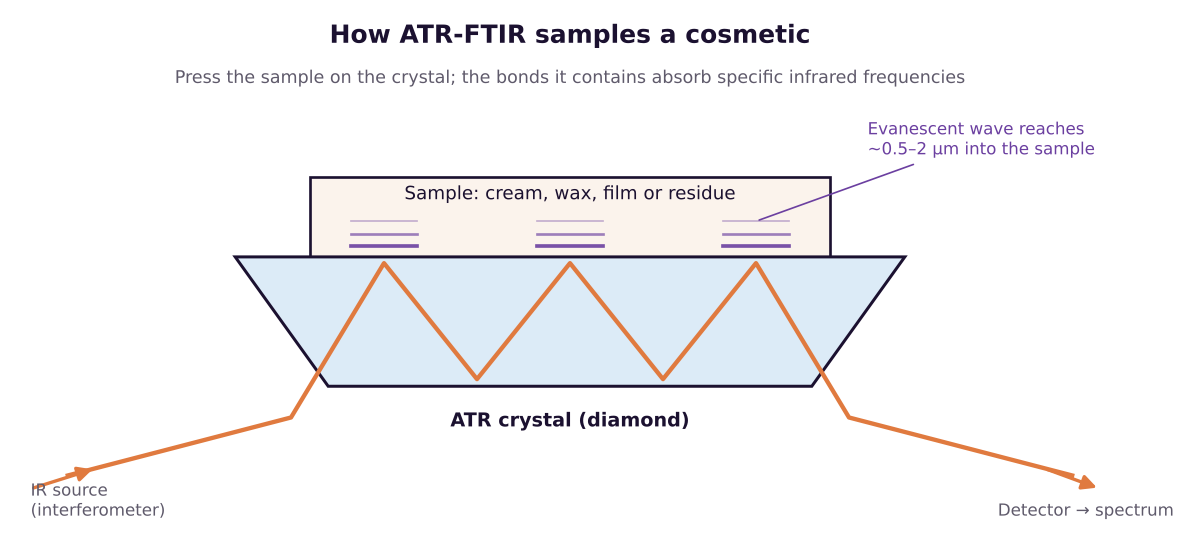
Most cosmetic labs use ATR (attenuated total reflectance), the simplest of the FTIR sampling techniques. The sample is pressed onto a diamond crystal and an evanescent wave probes the surface layer, so creams, waxes, films and dried residues need almost no preparation [4]. The region above 1500 cm⁻¹ reveals functional groups; the fingerprint region below it is unique to each molecular structure and drives spectral library matching.
04Where FTIR fills the GC-MS gap
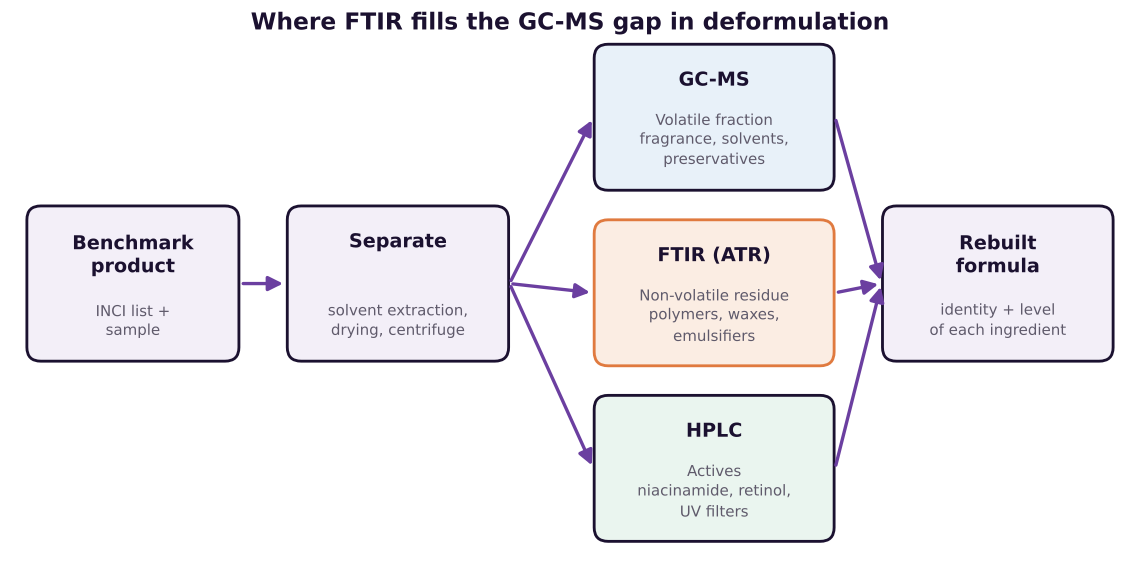
GC-MS is excellent for volatile organic molecules such as fragrance compounds, solvents and many preservatives. It cannot handle materials that decompose before they vaporise. That rules out most of the ingredients that give a product its structure: carbomers, acrylates copolymers, high-viscosity dimethicone, polyethylene, waxes and ethoxylated emulsifiers such as PEG-100 stearate or polysorbates.
In deformulation, labs therefore split a product: the volatile fraction goes to GC-MS, actives go to HPLC (see our guide to how HPLC works), and the non-volatile residue goes to FTIR for polymer identification.
Preparing that residue matters. Water and solvents are evaporated first, because water absorbs strongly near 3300 and 1640 cm⁻¹ and hides weaker bands. Oils and waxes can then be separated by sequential extraction with hexane, ethanol and water, so each fraction gives a cleaner spectrum and a better library match.
05Typical FTIR peaks for common cosmetic ingredients
| Ingredient | Key bands (cm⁻¹) | What they show |
|---|---|---|
| Polyethylene / paraffin wax | 2915, 2848, 1470, 730/719 doublet | Long CH₂ chains; the doublet signals crystalline order [3], [5] |
| Polypropylene | 2950, 1377, 1166, 997/972 | CH₃ side groups; read the bands together, since 1377 also appears in LDPE [5] |
| Beeswax, ester waxes | 2915, 2848, 1736, 1172 | Ester C=O and C–O on a hydrocarbon backbone [3] |
| Dimethicone | 1258, 1080/1010, 790 | Si–CH₃ and Si–O–Si backbone [3] |
| Carbomer | ~1700, broad 3000–2500 | Carboxylic acid; shifts to ~1550 when neutralised [3] |
| PEG esters, polysorbates | broad 3450, 1736, ~1105 | Ether C–O–C of the PEG chain plus ester C=O [3] |
| Water (in creams) | broad 3300, 1640 | Masks other bands; dry the sample first |
06What it means for formulators
- Back "microplastic-free" claims with data. The EU restriction on intentionally added synthetic polymer microparticles applies to rinse-off cosmetics from 17 October 2027, leave-on products from 17 October 2029, and lip, nail and make-up products from 17 October 2035 [6]. FTIR on the dried residue is a fast first check before claim testing.
- Identify packaging material. A quick ATR scan confirms whether a jar or liner is PP, HDPE or PET before compatibility work.
- Check incoming raw materials. Comparing each wax or polymer lot to a retained reference spectrum catches supplier switches early. Our sourcing team uses the same approach.
- Match a benchmark texture. When a competitor product feels lighter or more stable, the FTIR spectrum of its residue often points to the thickener or silicone responsible, which narrows the shortlist before any lab batches are made.
- Know the limits. Mixtures produce overlapping spectra, and FTIR rarely quantifies below a few percent. In a study of 99 products, combining spectral correlation with principal component analysis improved classification [2].
07For brands and formulators
FTIR is one part of how we decode a benchmark. Combined with GC-MS, HPLC and microscopy, it tells us which structuring ingredients a competitor uses so we can match texture and stability. See reverse engineering and benchmarking, our hub deformulation explained: from INCI list to a working formula, and our overview of analytical methods used in cosmetic formulation.
Need a benchmark decoded or a polymer identified?
We run ATR-FTIR, GC-MS and HPLC on benchmark products, raw materials and packaging, and turn the results into a working formula.
08References
- Gamage S, Mahagamage Y. Microplastics in personal care products and cosmetics in Sri Lanka. Heliyon. 2024;10(8):e29393. doi:10.1016/j.heliyon.2024.e29393. Heliyon
- Assi S, Osselton D, Al-Obaidi H, Thomas J. Evaluation of Fourier transform-infrared spectroscopy for analysis of cosmetics. American Pharmaceutical Review. 30 Jun 2020. LJMU Research Online
- Coates J. Interpretation of infrared spectra, a practical approach. In: Encyclopedia of Analytical Chemistry. Chichester: Wiley; 2000. doi:10.1002/9780470027318.a5606. Wiley
- Smith BC. Fundamentals of Fourier Transform Infrared Spectroscopy. 2nd ed. Boca Raton (FL): CRC Press; 2011. doi:10.1201/b10777. CRC Press
- Jung MR, Horgen FD, Orski SV, et al. Validation of ATR FT-IR to identify polymers of plastic marine debris, including those ingested by marine organisms. Mar Pollut Bull. 2018;127:704–716. doi:10.1016/j.marpolbul.2017.12.061. NOAA repository
- Commission Regulation (EU) 2023/2055 of 25 September 2023 amending Annex XVII to Regulation (EC) No 1907/2006 (REACH) as regards synthetic polymer microparticles. OJ L 238, 27.9.2023, p. 67. EUR-Lex
Update log
- Published by Cosmetic Science Lab
This article is general technical information, not legal, regulatory or medical advice. Confirm requirements for your product and market before launch.